New and improved technologies are solving decades-old criminal cold cases. Sometimes innocent people, initially convicted of a crime they did not commit, finally got justice when the true culprit was discovered. One of those innocent victims might be humanity in the alleged crime of causing catastrophic global warming. Perhaps truth was the real victim?
Common Pattern
A slew of cold cases solved in recent years follows a disturbing pattern: In hindsight, the original investigators are found to have made many amateurish mistakes. The culprit often escaped justice due to incompetence. In some instances, the case failed because the people who were on the right track found their input ignored, opposed, or even ridiculed.
Later, when new investigators look at the cold cases with fresh eyes, they often find out that their predecessors have tried to cover up their incompetence to save face, making the job even harder.
The Hockey Stick Graph
That brings us back to 2001, when there was a vigorous scientific debate about the size of anthropogenic climate change. The alarmists claimed we were boiling the planet, while the skeptics were lukewarm. Everyone agreed that we barely had any understanding of climate and that the uncertainty was enormous.
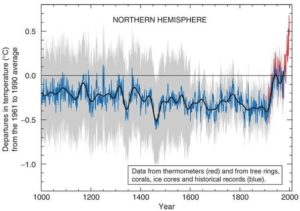 Then came the Third Assessment Report (TAR) of the U.N.’s Intergovernmental Panel on Climate Change. Plastered all over the study and in every media presentation was what became known as “the hockey stick graph.” It showed 900 years of stable temperature followed by a century of sharp warming.
The importance of this graph cannot be overstated. It convinced the world that manmade global warming now was proven beyond a shred of doubt, and the problem was dire. From this time onward, anyone who questioned climate alarmism was labeled a “denier.” The suspect was identified as humanity and proven guilty in the court of public opinion. Case closed.
But then a pesky Canadian engineer called Steve McIntyre became curious about how the graph was constructed. He emailed the author and requested the data so that he could verify it. To his great astonishment, he discovered that the data were largely unavailable. He was the first to ask to examine the data. None of the so-called peer reviewers had ever verified the calculations.
Despite the author’s increasing resistance and hostility, McIntyre persisted and did his best to collect the data and reconstruct the graph. He then made an incredible discovery: It was all gibberish – the equivalent of reading tea leaves.
The Wegman Report
It took five years of hard work and ridicule. Still, McIntyre was finally vindicated in 2006 by the so-called “Ad Hoc Committee Report on the ‘Hockey Stick’ Global Climate Reconstruction” led by one of the foremost statistical experts in the United States, Edward Wegman.
The Wegman report was devastating to the credibility of the IPCC. It proved beyond all reasonable doubt that the method used to construct the hockey stick could produce any desired outcome. Worse, any expert in the field would easily have seen the error that was made. The report unearthed structural incompetence on a massive scale in paleoclimatology.
The Cover-Up
Case closed, right? Nope. Typically, the Wegman report would have been the credibility death blow to the hockey stick graph and the scientists who had presented it. However, the reason you have probably never heard of this is that the media ignored it, and the IPCC pretended that nothing of consequence had challenged the report. What should have been a slam dunk became one of those unfortunate cases where the incompetent investigators were sufficiently powerful to cover up their mistakes.
 The Corrected Graph
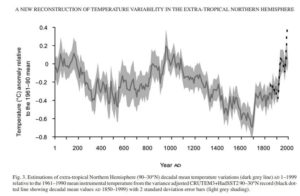
Since 2001, several new reconstructions have been made, including Ljungquist’s 2000-year temperature data set in 2010. Unlike the hockey stick graph, its result is more in line with climate history as it was known before 2001. It shows enormous climate variability with peaks during Pax Romana and the Medieval Warm Period and troughs during the Justinian plague and the Little Ice Age. More importantly, the graph shows that the warming in the 20th century was not unusual.
Like the Wegman report, you probably have never seen this graph, either. Careers are at stake. It makes many “experts” look bad. For now, truth and justice will need to wait a little longer – at least until people without faces to lose are willing to pick up the case.
~
Read more from Caroline Adana.

